


Introduction: Start with a Picture and Tell a Story
Recently, on the global trade map, a seemingly distant Red Sea crisis is quietly affecting each of our lives. Imagine that you walk into a supermarket as usual, ready to buy a pack of your favorite coffee, but find that the price is much higher than before. Or you notice that the price of a newly – launched mobile phone is also on the high side. At this time, you may wonder, “How can this seemingly distant conflict in the Middle East make our wallets thinner?” This is like a “butterfly effect.” A single missile in the Red Sea may ultimately stir up a hurricane of global consumer goods prices. This article will use the simplest logic to break down the price – rising chain from the ocean to the shelves.
Chapter 1: The Eye of the Storm: Why Is the “Blood Vessel” in the Red Sea Cut Off?
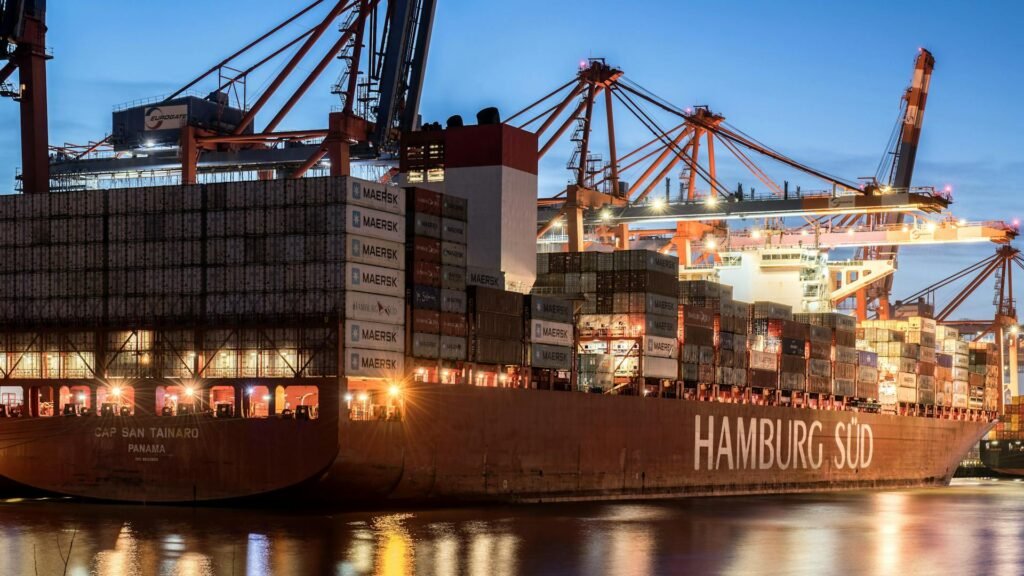
In the international logistics industry, the Red Sea – Suez Canal is like the “highway” of global trade. It is the shortest and most economical maritime route between Asia and Europe. According to statistics from the International Maritime Association, about 12% of the world’s trade goods are transported through the Suez Canal. This route greatly shortens the transportation time and cost, just like an important blood vessel in the human body, continuously supplying “blood” to global trade. Thousands of cargo ships shuttle through here every year, carrying goods worth hundreds of millions of dollars.
However, the attacks by the Houthi rebels have made this “highway” extremely dangerous. Since the Houthi rebels launched a series of attacks on passing ships, the security situation in the Red Sea has deteriorated sharply. Can you imagine? The once – peaceful maritime route is now like a minefield, and every passing ship faces the risk of being attacked.
To ensure the safety of crew members and cargo, most container ships choose to bypass the Cape of Good Hope in Africa. Although this choice guarantees safety, it brings a series of subsequent chain reactions, just like a domino effect. A small move has triggered an upheaval in the global logistics network.
Comparison Table of the Suez Canal and the Cape of Good Hope Route
| Route | Transportation Time | Transportation Cost | Safety |
|---|---|---|---|
| Suez Canal | Short | Low | High originally, but reduced due to attacks |
| Cape of Good Hope Route | Long | High | Relatively high |
Chapter 2: The First Domino: The “Distance and Time” Costs of Bypassing
When ships travel from Asia to Europe and bypass the Cape of Good Hope, the voyage is significantly extended. Data shows that for ships that originally took the Suez Canal route, bypassing the Cape of Good Hope adds about 10 – 14 days to the journey. For example, a ship traveling from Shanghai to Hamburg, which originally took 30 days via the Suez Canal, now takes 40 – 45 days. These extra ten – plus days are like a long – distance marathon for the logistics industry. Every additional day means increased costs and greater market risks.
The first impact of the longer voyage is the increase in time cost. As the goods are in transit for a longer time, warehouses remain empty, and the market has to wait longer for the arrival of goods. It’s like a product that was originally delivered on time suddenly gets delayed. The balance between supply and demand in the market is disrupted. For merchants, the late arrival of goods may mean missing the peak sales season, and situations like overstock or out – of – stock may occur, greatly reducing profits. Have you ever heard your freight forwarder say, “I have no idea when this ship will arrive. I’m really helpless”?
Meanwhile, the longer distance means a huge increase in fuel consumption. Fuel is one of the main costs for ships at sea. The extended voyage around the Cape of Good Hope requires ships to consume much more fuel. Studies show that bypassing the Cape of Good Hope can increase fuel costs by about 30% – 50%, which is the most direct cost increase. It’s like driving a long – distance journey; the farther the distance, the higher the fuel consumption and the greater the expense.
Flow Chart of Changes in Transportation Time and Cost
- Suez Canal Transportation: Normal transportation time – Low fuel cost – Goods arrive at the market on time – Market supply – demand balance
- Cape of Good Hope Bypass Transportation: Long transportation time – High fuel cost – Goods arrive at the market late – Market supply – demand imbalance
Chapter 3: Tightening Capacity: The World’s Ships Are in Short Supply
We can think of the global container fleet as a bus fleet in a city. Under normal circumstances, each bus runs on a fixed schedule between points A and B, and the transportation capacity is stable, meeting market demand. However, when ships bypass the Cape of Good Hope, the time it takes for each “bus” to complete a round – trip changes from 30 days to 45 days. With the same number of ships, the number of trips they can complete is greatly reduced.
This makes the “buses” (ships) scarce, and the “tickets” (freight rates) naturally skyrocket. According to shipping market data, since the Red Sea crisis forced ships to bypass, freight rates on some routes have increased by 2 – 3 times. The increase in freight rates undoubtedly adds to the cost of goods transportation, laying the groundwork for subsequent price increases. For cargo owners, this is like a nightmare. The originally reasonable freight rates suddenly double, and the profit margin is greatly compressed. The customs blacklist is like the credit score in the logistics industry, and the rising freight rates are like a “heavy punch” to cargo owners.
Professional freight forwarders usually adopt industry solutions such as signing long – term cooperation agreements with shipowners in advance to lock in a certain amount of shipping capacity and freight rates to cope with market fluctuations. At the same time, freight forwarders also arrange transportation methods and routes reasonably according to the urgency and importance of the goods to minimize costs.
Chapter 4: Risk Premium: Insuring for the “Dangerous Journey”
As long as a ship enters a dangerous area (even if it’s just passing by the Red Sea), the shipowner needs to purchase additional war – risk insurance. This is to deal with possible risks such as attacks and seizures. The cost of this insurance is quite high and keeps rising as the risk increases.
Data shows that since the Red Sea crisis, the cost of war – risk insurance has increased several times. To make up for this cost, shipowners include this high insurance fee in the total freight, which is ultimately borne by the cargo owners. After paying higher freight, cargo owners will inevitably pass on this cost to the commodity prices to ensure their profits. It’s like a series of “shackles” that continuously increase the cost of commodities.
Chapter 5: Transmission to the End – Consumer: Why Are Your Coffee and Mobile Phones Getting More Expensive?
Summary of the Logical Chain
The entire logical chain of price increases can be summarized as follows: Route interruption → Bypass around the Cape of Good Hope → Longer voyage and increased fuel consumption → Tight global shipping capacity + Higher insurance fees → Soaring ocean freight rates. This series of chain reactions ultimately leads to the increase in commodity prices. It’s like a chain where any change in one link will affect the final result.
Specific Commodities
Coffee (Representing Bulk Agricultural Products and Daily Consumer Goods)
European coffee beans are mainly imported from Africa and Asia. Transportation cost is an important part of the total cost. Under normal circumstances, the transportation cost of coffee beans is relatively stable, accounting for about 10% – 15% of the total cost. However, when the freight rate doubles or triples, when spread across each bag of coffee or each coffee bean, the proportion of transportation cost may rise to 30% – 40%. To ensure profits, the retail price of coffee will inevitably increase. Imagine that the coffee you usually drink becomes more and more expensive because of a crisis far away in the Red Sea. Isn’t it frustrating?
Mobile Phones (Representing High – value Industrial Products Dependent on Just – in – Time Supply Chains)
The components of mobile phones come from all over the world, and the finished products are shipped from factories in places like China to Europe. Not only does the transportation cost of the finished products increase, but the delay in component transportation can also cause production lines to stop waiting for materials. Mobile phone production is a process highly dependent on just – in – time supply chains.
The timely supply of each component is crucial for the normal operation of the production line. Once the component transportation is delayed, the production line will stop waiting for materials, resulting in a decrease in production efficiency and an increase in costs. Some mobile phone manufacturers have reported that a one – day production line shutdown due to logistics delays can result in losses of millions of dollars. These increased logistics and manufacturing costs will ultimately be reflected in the retail price of mobile phones.
Summary
It’s not just coffee and mobile phones. Almost all commodities transported via this route, from furniture, toys to automobile parts, face the same cost pressure. It can be said that the impact of the Red Sea crisis has spread to every corner of global trade. In this era of globalization, no industry can remain untouched.
Conclusion: We Live in a Closely – Connected World
Looking back at the “butterfly effect” again, one missile → One ship changing its route → Fluctuations in the global logistics network → Changes in what’s on our tables and in our pockets. In the era of globalization, there are no isolated events. Geopolitics is no longer just a distant story in the news; it is directly linked to everyone’s cost of living.
Understanding the logic behind this can help us view global economic fluctuations and personal consumption choices more clearly. When facing price increases, we know that it’s not just a simple market fluctuation but is due to complex global logistics and geopolitical factors. In the future, we can also respond to similar economic changes more rationally.